4.4 Statistical test selection
Knowing what statistical test fits your research question is crucial for the success of your research. If you do not know what test to apply or even choose the wrong test, you may draw the wrong conclusions. This can lead to a waste of time and resources, and it can even lead to harm if the wrong conclusions are used to make decisions.
Statistics such as means, proportions, variances, and correlations are calculated on variables. For translating a research hypothesis into a statistical hypothesis, the researcher has to recognize the dependent and independent variables addressed by the research hypothesis and their variable types. The main distinction is between dichotomies (two groups), (other) categorical variables (three or more groups), and numerical variables. Once you have identified the variables, the flow chart in Figure 4.18 helps you to identify the right statistical test.
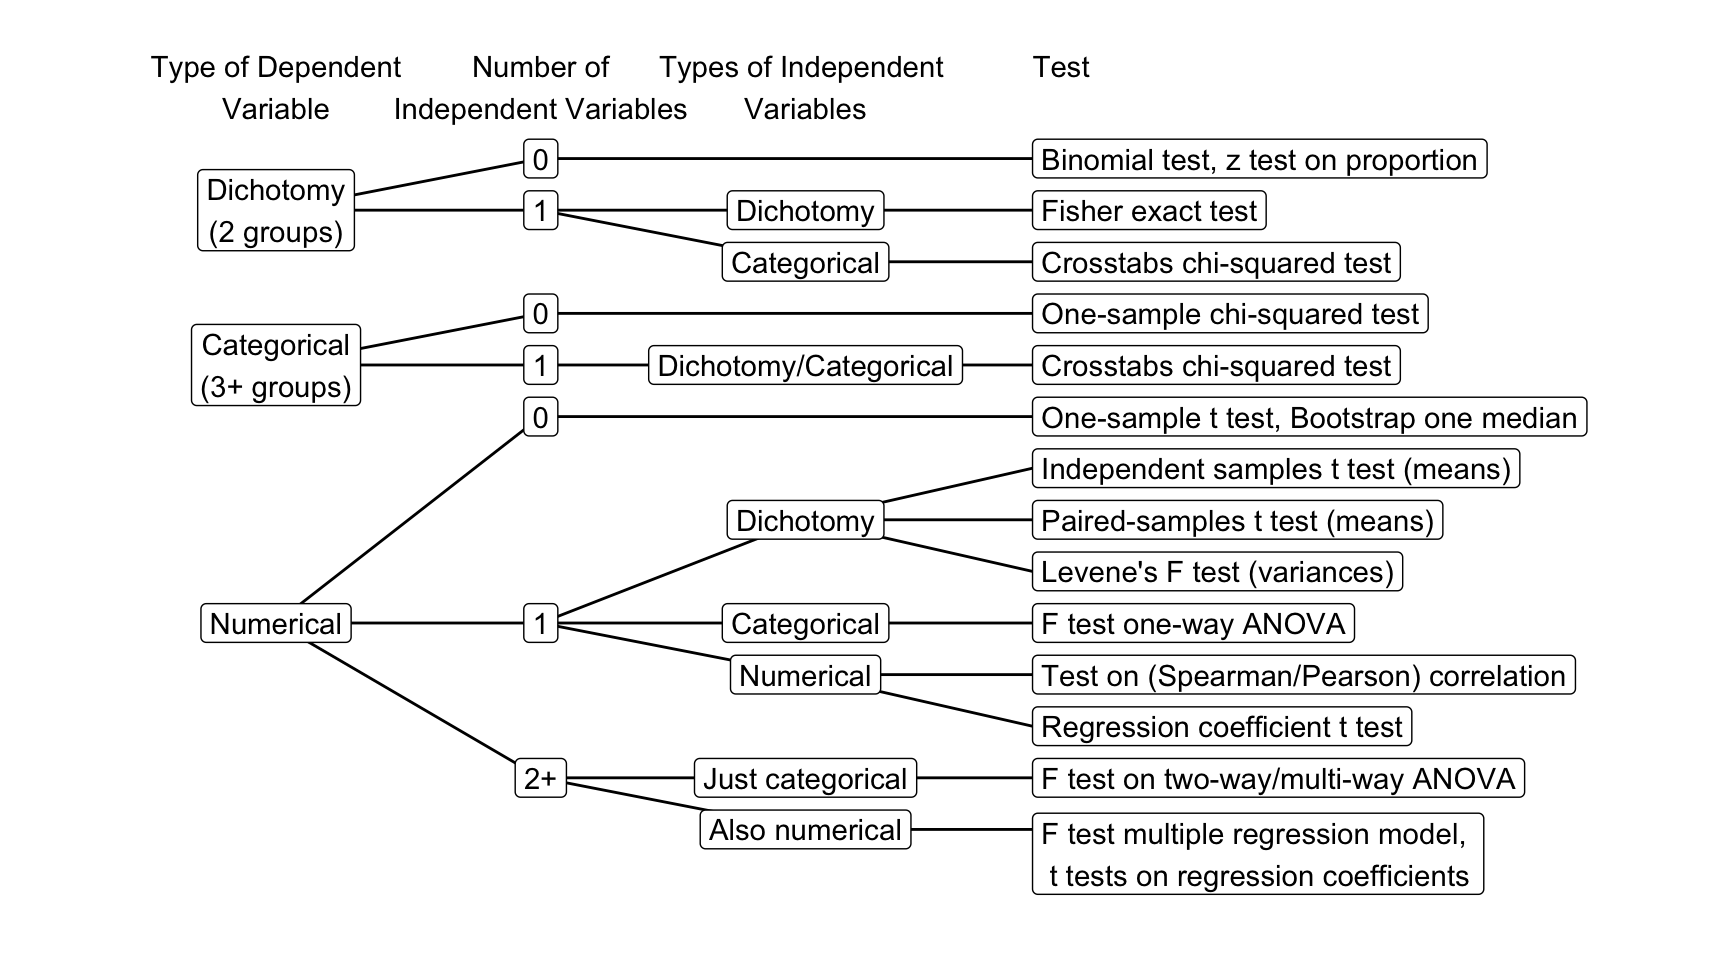
Figure 4.18: Flow chart for selecting a test in SPSS.
You use the flow chart by identifying the type of your dependent variable (categorical or numerical) and the number and type of your independent variable (categorical or numerical). The flow chart then guides you to the right statistical test.
Consider the following example. You want to measure the difference in media literacy between man and women, and want to control for age. You measure media literacy on a scale from 1 to 7, and age in years. You have a numerical dependent variable (media literacy) and a categorical independent (biological sex), and a numerical independent variable (age). As your dependent variable is numerical, you follow the flow chart to the right. As you have two independent variables, you follow the flow chart to the right to indicate that you have both a categorical and numerical independent variable. The flow chart guides you to the F test multiple regression model.