Flow chart statistical test selection
The flow chart in figure 9.17 helps you select the appropriate statistical test based on the type of dependent and independent variables.
It helps in the learning proces to think of different research designs for each test. Try to think of one for the independent samples t-test. Work your way from right to left to determine the type of variables and think of some research that conforms to this.
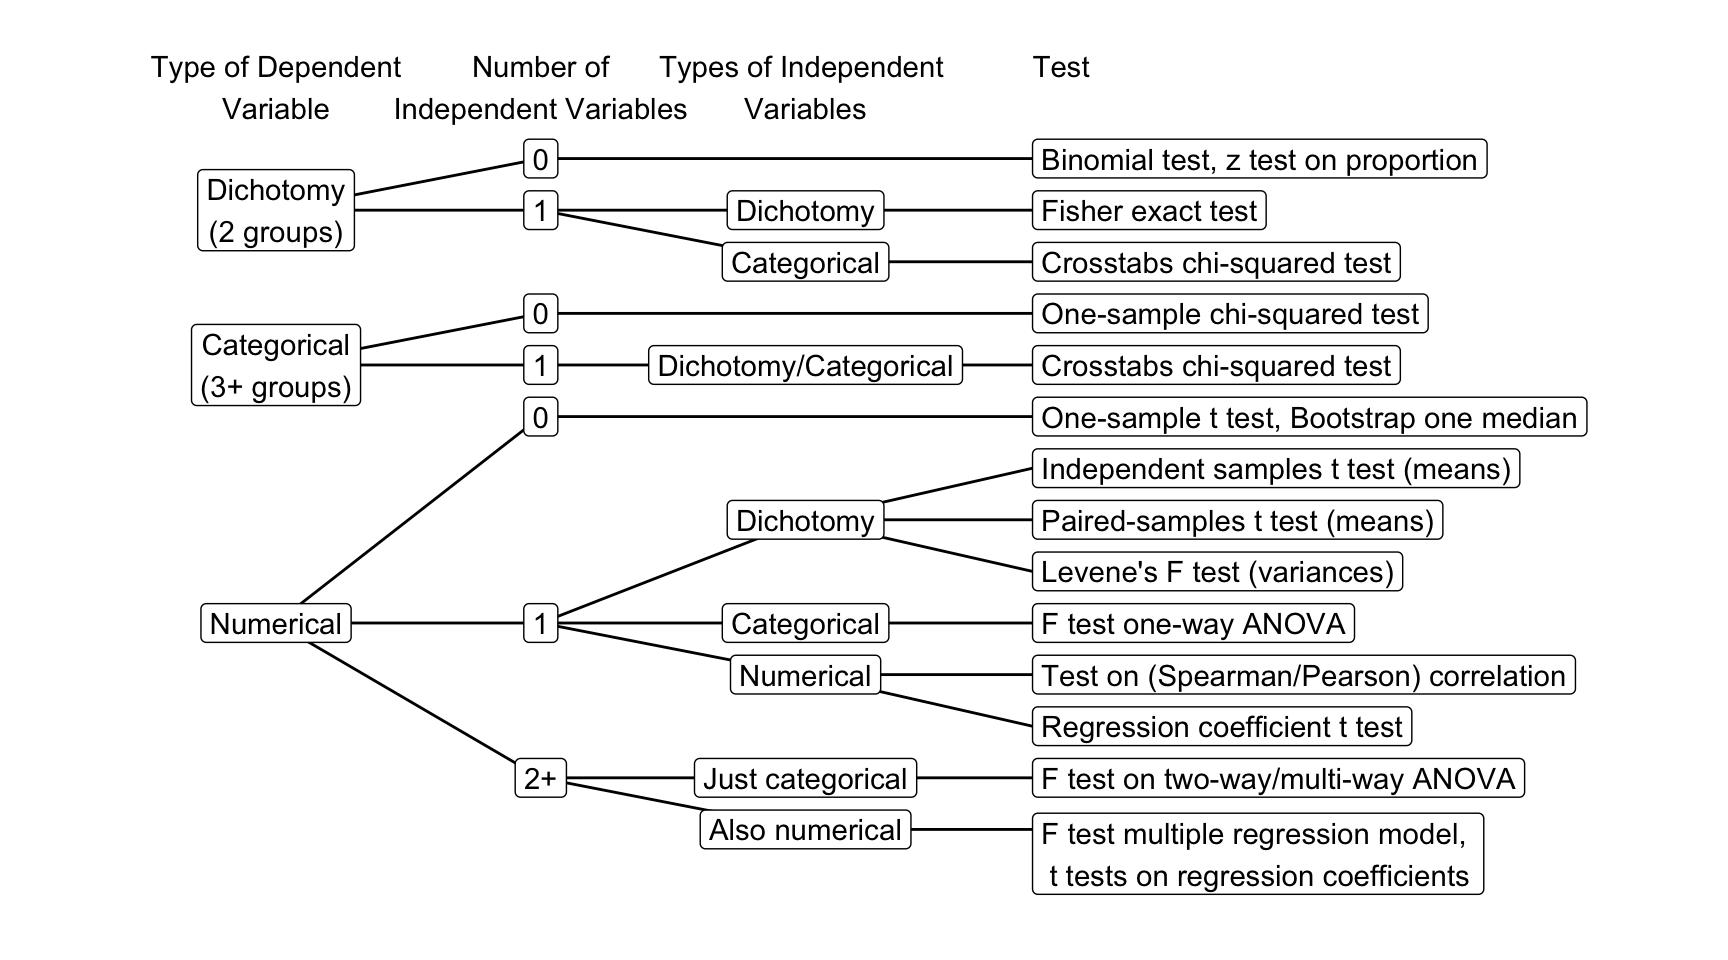
Figure 9.17: Flow chart for statistical test selection.
An interactive tool for test selection made by Matt Jackson-Wood can be found here.