5.5 Reporting Two-Way Analysis of Variance
The main purpose of reporting a two-way analysis of variance is to show the reader the differences between average group scores on the dependent variable between groups on the same factor (main effects) and different differences for groups on a second factor (interaction effect). A means plot is very suitable for this purpose. Conventionally, we place the predictor groups on the horizontal axis and we draw different lines for the moderator groups. But you can switch them if this produces a more appealing graph.
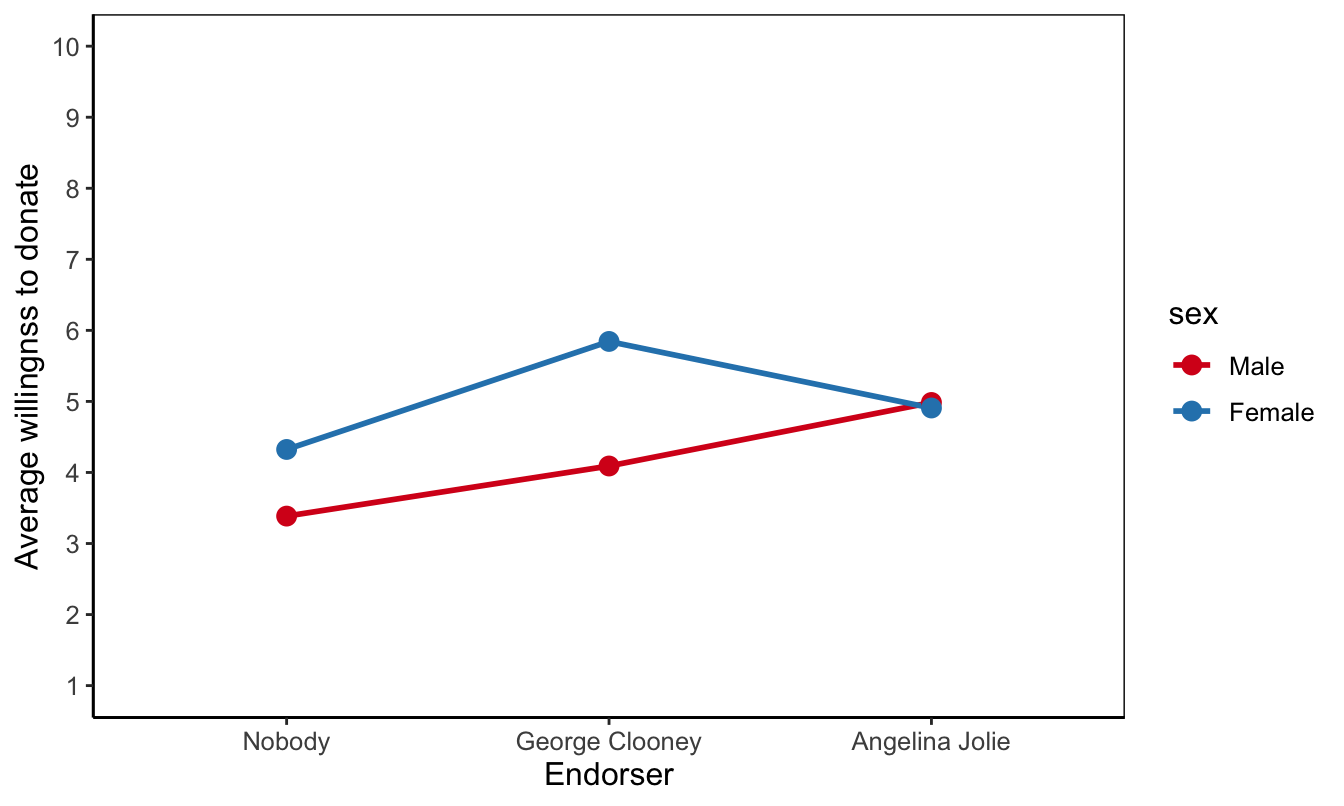
Figure 5.17: An example of a means plot.
For the statistically informed reader, you should include the following information somewhere in your report:
That you used analysis of variance and the analysis of variance type (one-way or two-way).
The test result for every effect, consisting of the test name (F), the degrees of freedom, and the significance (p value). APA prescribes the following format if you report the test result within your text: F (df1, df2) = F value, p = p value. Note that df1 is the degrees of freedom of the factor (between-groups) and df2 is the degrees of freedom of the error (within-groups).
For each effect report eta-squared (eta2) and interpret it in terms of effect size. If you have to calculate eta-squared by hand, divide the between-groups sum of squares of an effect by the total sum of squares (SPSS: corrected total). If SPSS calculates eta-squared, also report the confidence interval for eta-squared.
For each effect worth interpretation, clarify which group or subgroup scores higher. Report the group means and their standard deviations or the mean difference with its confidence interval and p value (from the post-hoc tests) here. Note that the SPSS menu only supplies post-hoc tests for main effects of factors with more than two levels (groups).
Pay special attention to an interaction effect. Explain how an effect (differences between groups) of the predictor differs across groups on the moderator. This results in sentences containing three variables. For example: “Clooney as endorser increases willingness to donate more among women than among men.” Do you recognize the three variables (predictor, moderator, and dependent variable) here?
As always, don’t forget to mention the units (cases) and the meaning of the variables (factors and outcome). They describe the topic of the analysis.
Report it if the main assumption is violated, that is, if you have (sub)groups of unequal size and the test on homogeneous variances is statistically significant. Report Levene’s test just like you report the F test of a main effect (see above). If the assumption is violated, we still report and interpret the results of the analysis of variance but we warn that the results may not be trustworthy.
A two-way analysis of variance may produce many numeric results to report. It is recommended to present them as a table (in the text or in an appendix). If you report the table, include the error, the sums of squares and mean squares in the same way that SPSS reports them. Table 5.2 presents an example.
| Sum of Squares | df | Mean Square | F | p | |
|---|---|---|---|---|---|
| sex | 26.37 | 1 | 26.37 | 11.86 | 0.001 |
| endorser | 38.05 | 2 | 19.03 | 8.56 | < 0.001 |
| endorser*sex | 20.60 | 2 | 10.30 | 4.63 | 0.011 |
| error | 304.54 | 137 | 2.22 | ||
| Total | 389.56 | 142 |