5.2 One-Way Analysis of Variance in SPSS
5.2.1 Instructions
In SPSS, we use the One-Way ANOVA option in the Compare Means submenu for one-way analysis of variance and the Univariate option in the General Linear Model submenu for two-way analysis of variance.
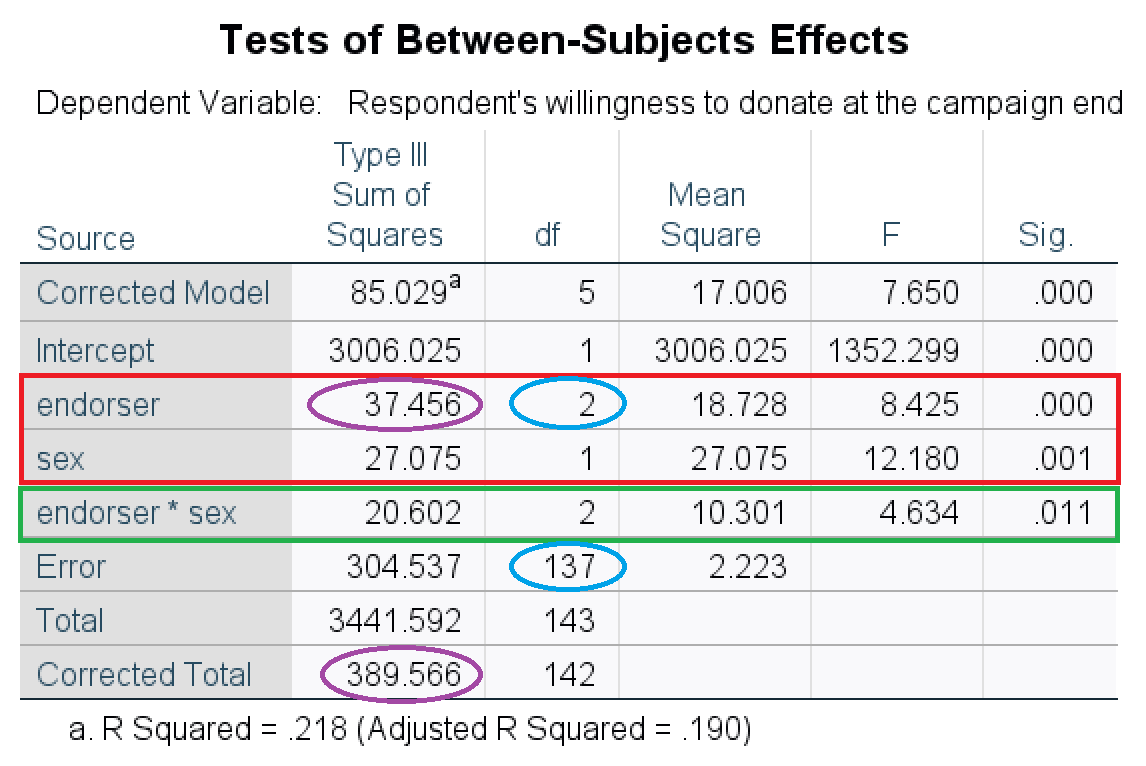
Figure 5.6: SPSS table of main and interaction effects in a two-way analysis of variance.
The significance tests on the main effects and interaction effect are reported in the Tests of Between-Subjects Effects table. Figure 5.6 offers an example. The tests on the main effects are in the red box and the green box contains the test on the interaction effect. The APA-style summary of the main effect of endorser is: F (2, 137) = 8.43, p < .001, eta2 = .10. Note the two degrees of freedom in between the brackets, which are marked by a blue ellipse in the figure. You get the effect size eta2 by dividing the sum of squares of an effect by the corrected total sum of squares (in purple ellipses in the figure): 37.456 / 389.566 = 0.10.
Interpret the effects by comparing mean scores on the dependent variable among groups:
If there are two groups on a factor, for example, females and males, compare the two group means: Which group scores higher? For example, females score on average 5.05 on willingness to donate whereas the average willingness is only 4.19 for males. The F test shows whether or not the difference between the two groups is statistically significant.
If a factor has more than two groups, for example, Jolie, Clooney, and no celebrity endorser, use post-hoc comparisons with Bonferroni correction. The results tell you which group scores on average higher than another group and whether the difference is statistically significant if we correct for capitalization on chance.
If you want to interpret an interaction effect, create means plots such as Figure 5.7. Compare the differences between means across groups. In the left panel, for example, we see that the effect of sex on willingness to donate (the difference between the mean score of females and the mean score of males) is larger for Clooney (pink box in the middle) than for no celebrity endorser (pink box on the left), and it is smallest for Angelina Jolie (pink box on the right). Similarly, we see that the effect of seeing Clooney instead of no celebrity endorser is larger for females (right-hand panel, pink box on the right) than for males (right-hand panel, pink box on the left).
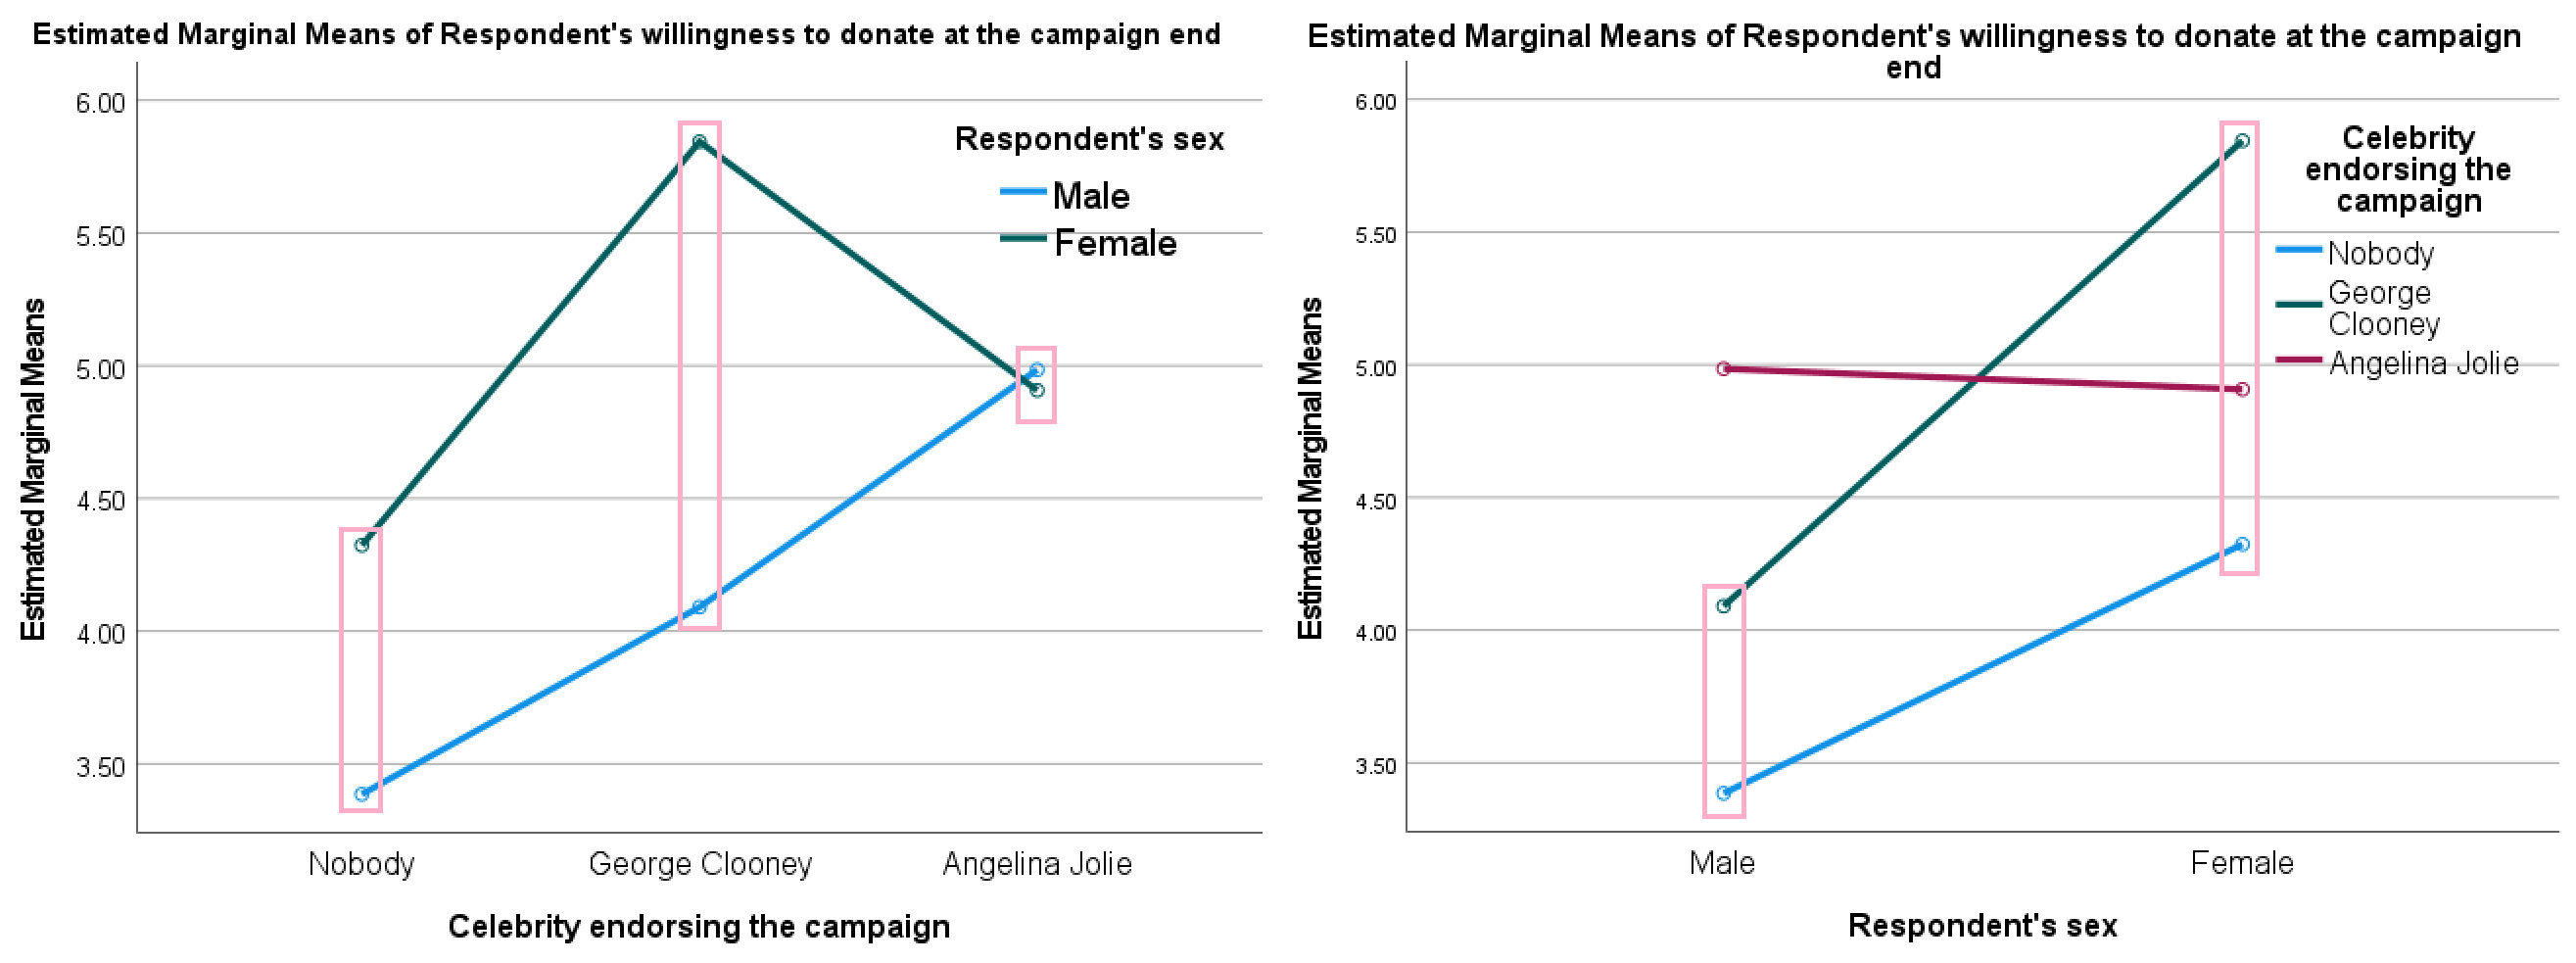
Figure 5.7: SPSS means plots of the interaction effect of sex and endorser on willingness to donate. Note that the pink boxes have been added manually to aid the interpretation.
Figure 5.8: One-way analysis of variance (ANOVA) in SPSS.