9.2 Path Model with Regression Analysis
Mediation or, more generally, path models can be estimated with a series of regression models. Every variable in the path diagram with at least one predictor (or incoming arrow) is a dependent variable, so for each of them, we estimate a regression model. The regression model contains all variables as predictors that may cause changes in the dependent variable. In other words, all variables that are causally prior to the outcome are used as predictors. In a well-designed causal diagram, all variables to the left of the outcome are causally prior to it.
Figure 9.5: Path diagram with unstandardized effect sizes and their 95% confidence intervals.
In the path diagram displayed in Figure 9.5, we would regress newspaper reading time, the final dependent variable, on age and political interest. As a next step, we would predict political interest as outcome from age.
9.2.1 Requirements
We can estimate mediation and path models with regression analysis if we meet the following requirements:
Each variable used as a dependent variable is numeric. This is a general requirement of a linear regression model. In a path diagram, it means that all mediators and dependent variables must be numeric.
For detail lovers: Variables with only incoming arrows may be dichotomous but that requires logistic regression, which we do not discuss.
Each variable used only as a predictor must be a numeric or dichotomous (dummy) variable. Again, this is a general requirement of regression models.
There are no causal feedback loops. Causality must work in one direction. It must be impossible to travel from a variable back to it while following the direction of the arrows. Note that it can be difficult to assign a causal order. For example, does political interest cause (low) political cynicism or the other way around? Or are they not causally related at all?
All regression models meet the assumptions for regression analysis. Check if the residuals are normally distributed, centered around zero for all levels of the predicted outcome scores, and that scores are predicted equally well at all outcome levels (see Section 6.1.4).
9.2.2 Size of indirect effects
The regression results tell us the sizes and statistical significance of all direct effects on the dependent variable. Both unstandardized and standardized regression coefficients can be used to interpret effects in the usual way. But how do we obtain the size, confidence interval, and statistical significance of indirect effects?
The size of an indirect effect is calculated in exactly the same way as the size of indirect correlations (Section 8.2): Just multiply the size of direct effects. This can be done with either the standardized regression coefficients or the unstandardized regression coefficients.
Figure 9.6: Path diagram with unstandardized effect sizes and their 95% confidence intervals.
It may sound weird that we can multiply the unstandardized regression coefficients but it really works. In Figure 9.6, for instance, the unstandardized partial effect of age (measured in tens of years) on interest in politics is 0.1. This means that an additional 10 years of life predict an average increase in interest in politics of 0.1.
In its turn, interest in politics has an unstandardized effect of 0.32 on reading time (in minutes). An additional unit of interest in politics predicts an average increase in reading time of 0.32 minutes.
Ten additional years of life only predict an increase of 0.1 in political interest, not a full unit increase. The predicted increase of 0.1 in political interest predicts 0.1 * 0.32 = 0.03 minutes of additional newspaper reading time. As a result, an additional ten years of life predict 0.1 * 0.32 = 0.03 minutes of additional newspaper reading time as an indirect effect via political interest.
Note that the indirect effect is interpreted in terms of the measurement units of the initial predictor (age in tens of years) and the final outcome (reading time in minutes): A difference in (tens of) years predicts a difference in reading time in minutes. As a consequence, we can directly compare unstandardized indirect effect sizes of different paths between the same predictor and outcome, as we will see in Section 9.2.5.
9.2.3 Direction of indirect effects
Multiplication of direct effects assigns the right direction (positive or negative) to indirect effects. In the example above, age has a positive effect on interest in politics, which has a positive effect on newspaper reading time. If age goes up, interest in politics goes up and if interest in politics goes up, reading time increases. Thus, higher age is indirectly associated with more reading time through interest in politics: Plus times plus yields a plus.
9.2.4 Parallel and serial mediation
If each indirect effect in a path model contains at most one mediator, we have single mediation or parallel mediation. Figure 9.7 illustrates single and parallel mediation.
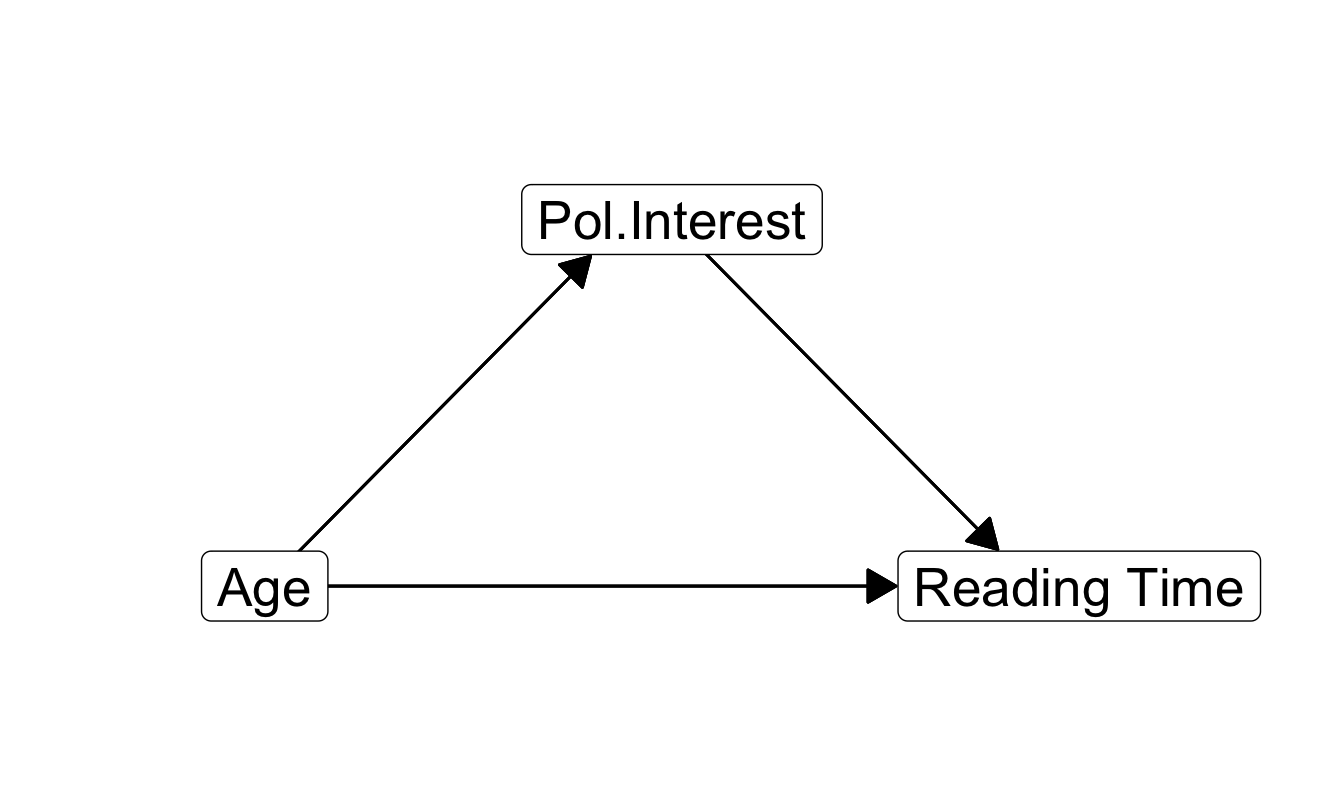
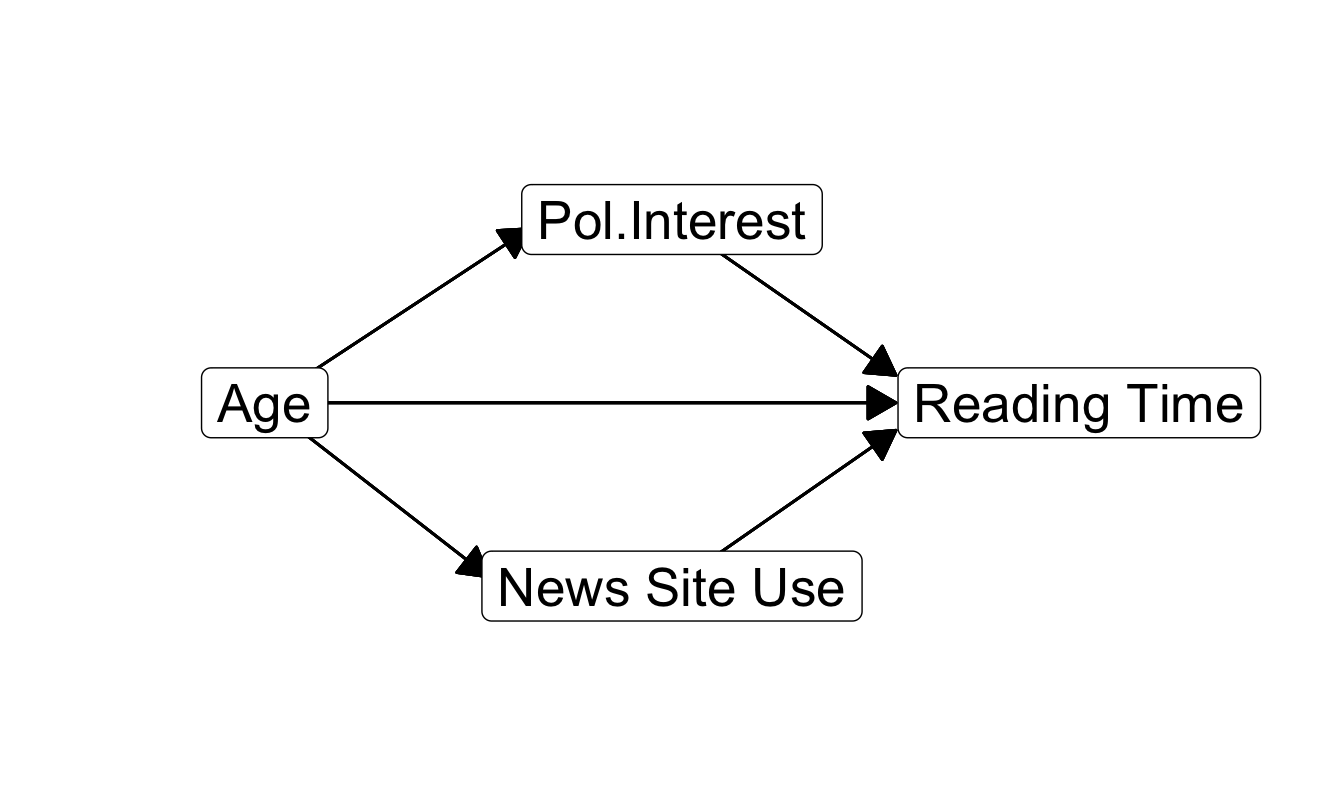
Figure 9.7: Causal diagrams for single (left) and parallel mediation (right).
If at least one of the indirect effects in a path model contains two or more mediators, we are dealing with serial mediation. Figure 9.8 illustrates serial mediation. It contains an indirect effect from age on reading time with two mediators: Age > Political Interest > News Site Use > Reading Time. The distinction between parallel and serial mediation is relevant to the software (PROCESS) that we will use to estimate indirect and total effects (Section 9.5).
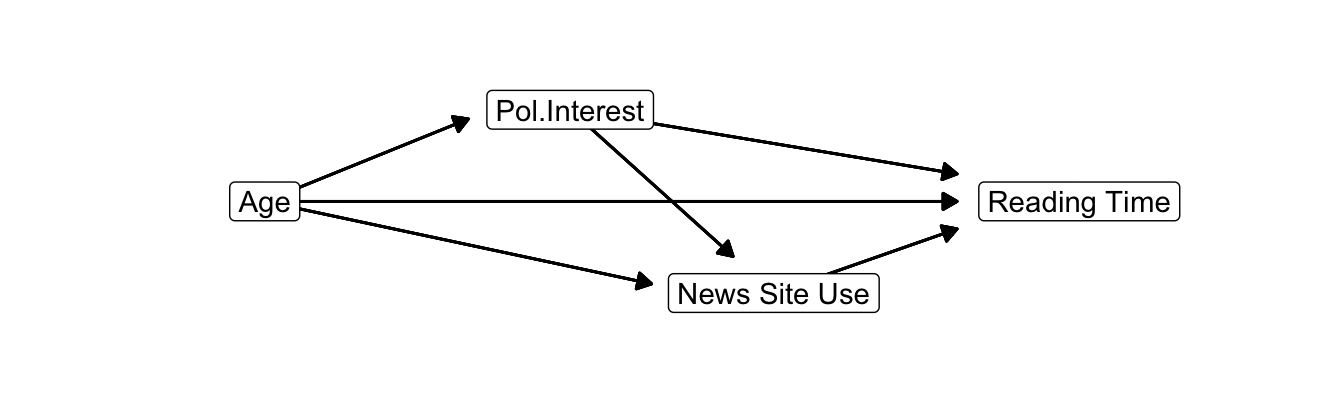
Figure 9.8: Causal diagram for serial mediation.
9.2.5 Partial and full mediation
The unstandardized direct effect and indirect effects between a predictor and outcome can be compared directly because they are all expressed in the same measurement units, namely the predicted change in the dependent variable (reading time in minutes) for a difference of one unit in the predictor (ten additional years of life) (Section 9.2.2). Because of this, we can sum the unstandardized direct and indirect effects to obtain the total unstandardized effect.
With this in mind, we see that the relation between age and newspaper reading time is dominated by the positive direct effect (b = 5.99) and the positive indirect effect via news site use (b = 0.03). The remaining indirect effects are relatively small as indirect effects usually are.
Summing all effects, we obtain a total effect of age on newspaper reading time around 6 (b = 6.03). A person who is ten years older but in other respects the same as another person, is predicted to spend on average 6 additional minutes on reading newspapers per day.
If the direct effect of a predictor on the outcome is zero in a model with mediators, the predictor’s effect is fully mediated. This clearly is not the case in our example: There still is a substantial direct effect of age on newspaper reading time. This is what we usually encounter; it is called partial mediation.
Sometimes, researchers decide that an effect is fully mediated if the direct effect is no longer statistically significant once a mediator is added to the model. This strategy is contestable because a statistically non-significant direct effect does not mean that the effect is absent (zero) in the population. It can be absent but it is much more likely to be present but just too small to be picked up by our significance test (see Chapter 4.2.7).
The distinction between full and partial mediation is a little bit problematic. From a substantive point of view, we may argue that direct effects are probably always mediated. As we have seen in Section 9.1.2, a direct effect usually summarizes a causal process that consists of intermediary steps, which is mediation. We may wonder whether it makes theoretical sense to talk about unmediated effects. Do we really believe that age can directly affect newspaper reading time?
If the variables that we entered in the model as mediators do not create any indirect effects, the direct effect is equal to the total effect. We may conclude that the direct effect is not mediated by the mediators that are included in the model. For example, if education, political interest, and news site use do not create indirect effects from age on newspaper reading time (Figure 9.6), we only have the direct effect of age on reading time in our model. However, this effect is very likely to be mediated by other variables that we did not include in the model. We should not conclude that the effect is unmediated because we have not found mediation yet.
9.2.6 Significance of indirect effects
SPSS does not calculate the size of indirect effects for us or their confidence intervals and p values. It is easy to calculate the sizes of indirect effects, as we have seen in a preceding section: just take the product of direct effects.
In contrast, it is not possible to calculate the confidence interval or p value of an indirect effect in a reliable way from the confidence intervals or p values of the direct effects (see Hayes, 2013: Section 4.4 for a detailed and critical discussion of approaches that try to calculate the p value of an indirect effect from p values of direct effects).
We use bootstrapping to create the sampling distribution of the size of an indirect effect. We have learned the principles and limitations of bootstrapping in Section 2.5, so we do not have to go into details here. Suffice it to repeat that our original sample must not be too small and it must be quite representative of the population if we apply bootstrapping.
| Effect | Boot SE | BootLLCI | BootULCI | |
|---|---|---|---|---|
| Total indirect effect | 1.47 | .42 | .62 | 2.25 |
| Age - Pol. Interest - Reading Time | .05 | .03 | .01 | .14 |
| Age - Pol. Interest - News Site Use - Reading Time | -.02 | .01 | -.05 | .00 |
| Age - News Site Use - Reading Time | 1.44 | .42 | .60 | 2.23 |
The confidence interval of an indirect effect can be calculated from its bootstrapped sampling distribution. Table 9.1 shows bootstrap results for the indirect effects in a model with age as predictor, newspaper reading time as dependent variable, and interest in politics and news site use as mediators.
In total, there is a substantial indirect effect of age on newspaper reading time in this model. We are confident that this effect is positive [b = 1.47, 95% CI [0.62, 2.25] (bootstrapped)]. It is easy to see that the indirect effect of age via news site use on reading time is by far the most important indirect effect [b = 1.44, 95% CI [0.60, 2.23] (bootstrapped)]. On its own, it is responsible for almost the entire total indirect effect.
It may happen that an indirect effect is not statistically significant (the confidence interval includes zero) whereas all direct effects that constitute the indirect effect are statistically significant. In Figure 9.9, for example, both the effect of age on political interest (b = 0.30, 95% CI [0.22, 0.38]) and the effect of political interest on reading time (b = 0.20, 95% CI [0.12, 0.28]) are statistically significant at the .05 level. The indirect effect of age via political interest on reading time, however, is not statistically significant at this level [b = 0.30 * 0.20 = 0.06, 95% CI [-0.02, 0.14], (bootstrapped)].
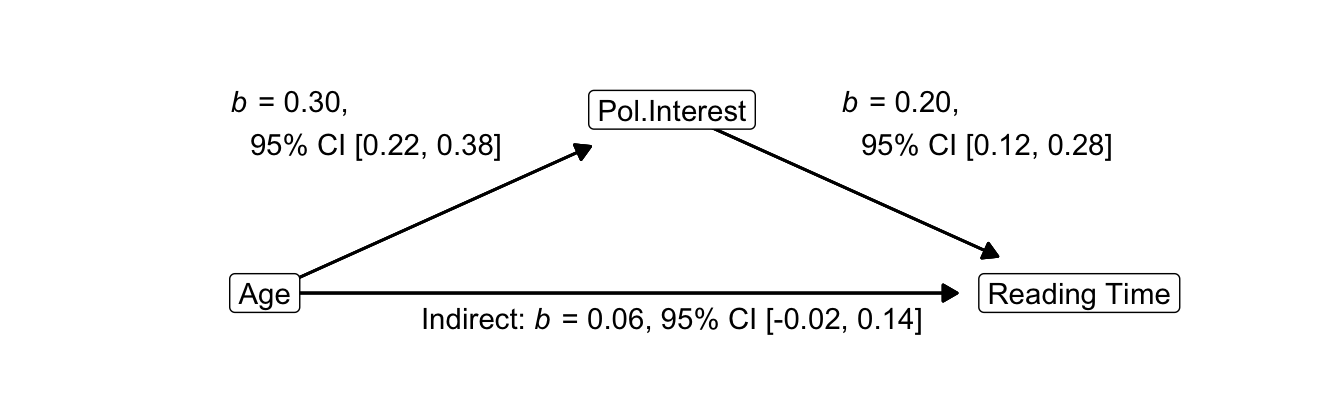
Figure 9.9: Causal diagram for the effects of age and interest in politics on newspaper reading time: unstandardized estimates with 95% confidence intervals.
This sounds like a paradox but it should not upset you. The unstandardized indirect effect tends to be weaker than the direct effects, that is, closer to zero. With a weaker effect, it is more difficult to reject the null hypothesis that the effect is zero in the population. We need a larger sample to reject null hypotheses for smaller effects (see Chapter 4.2.3 on power). In this case, report that all direct effects that create the indirect effect are statistically significant, so non-significance is likely to arise from low test power rather than from absence of an indirect effect in the population.